
Residential building materials prices climbed again in July, the greatest year-over-year increase in more than two years.
The fundamental price rise trend remained unchanged, with service costs outpacing goods prices.
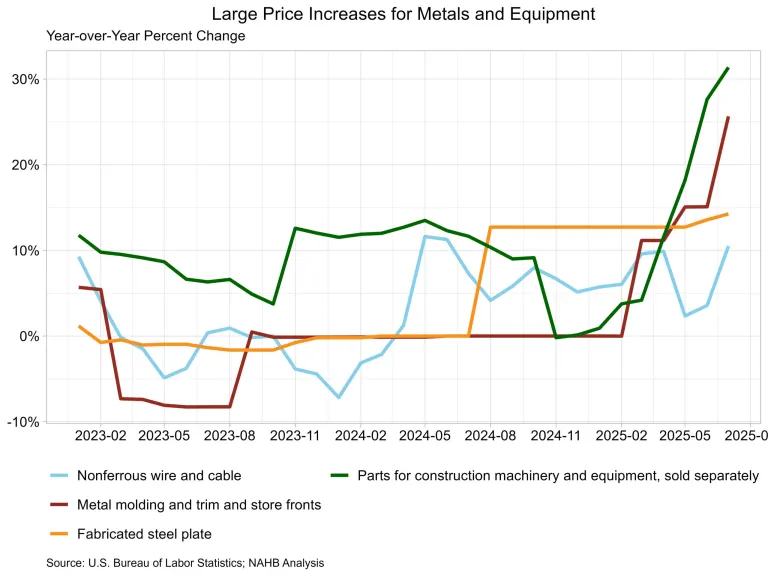
Similar to last month, parts for construction machines and metal molding/trim saw considerable price increases of more than 25% compared to the previous year.
Prices for new residential building inputs, excluding capital investment, labor, and imports, climbed 0.2% in July, following a 0.8% increase in June.
These numbers are from the most recent Producer Price Index (PPI) report released by the United States Bureau of Labor Statistics.
The PPI measures the prices that domestic producers receive for their goods and services; in contrast, the Consumer Price Index examines what consumers pay for both domestic and imported items.
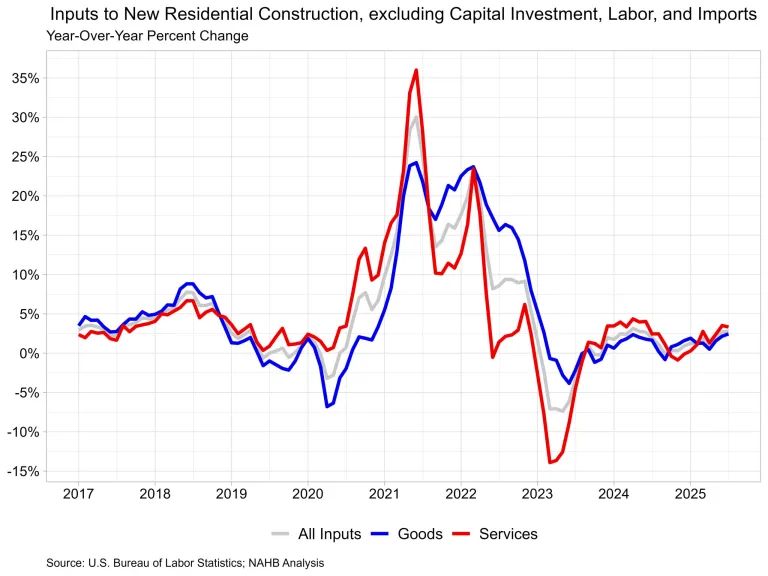
The inputs to the new residential building price index increased by 2.8% from July of last year.
The index is divided into two components: products, which climbed 2.4% during the year, and services, which increased 3.3%.
For contrast, the overall final demand index, which measures all products and services in the economy, climbed 3.3% year on year, with final demand for goods rising 1.9% and final demand for services rising 4.0%.
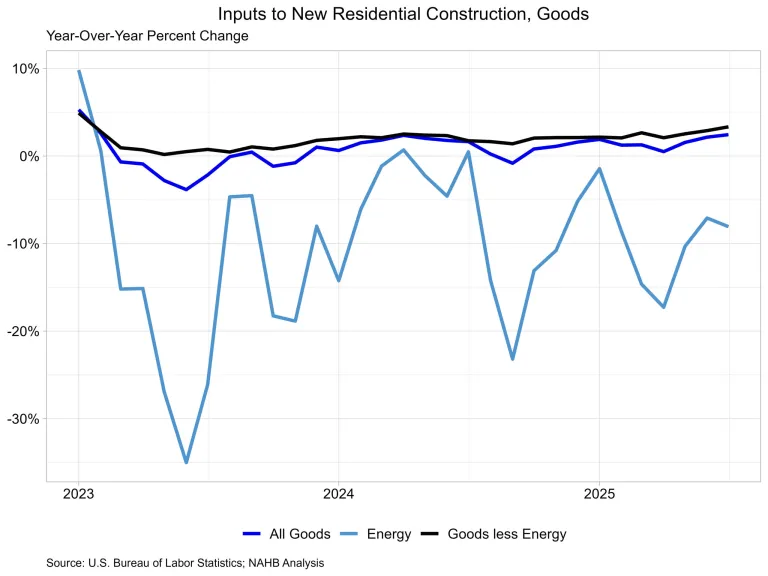
Input goods
The goods component accounts for approximately 60% of the total residential building inputs price index.
The monthly price of input commodities for new home building increased by 0.4% in July.
The input goods to the residential construction index are further divided into two components, one assessing energy inputs and the other measuring leftover products.
The latter of the two components essentially indicates building materials used in residential construction, which accounts for around 93% of the goods index.
Energy input prices increased 3.9% between June and July, but were 8.1% lower than a year ago.
Between June and July, building material prices rose 0.2%, and they were up 3.3% from the previous year.
Tariffs on building materials do not appear immediately in the PPI data since the PPI only measures prices for domestically manufactured goods and services.
Tariffs and taxes are explicitly omitted from the PPI. Despite this, price changes in response to tariffs are included in the PPI, thus price hikes to pass on increased material costs will be shown in this pricing data.
Tariffs announced in recent months have resulted in significant price hikes for a variety of goods, particularly certain metal products and equipment.
In July, the highest year-over-year increase in input prices was for construction machinery and equipment parts, which increased by 31.4%.
Metal molding and trim prices rose 25.6%, fabricated steel plate prices increased 14.3%, and nonferrous wire/cable prices rose 10.5%.
Tariffs have mostly targeted metal commodities, with 50% tariffs imposed on steel and aluminum products and a 50% duty on copper semifinished items.
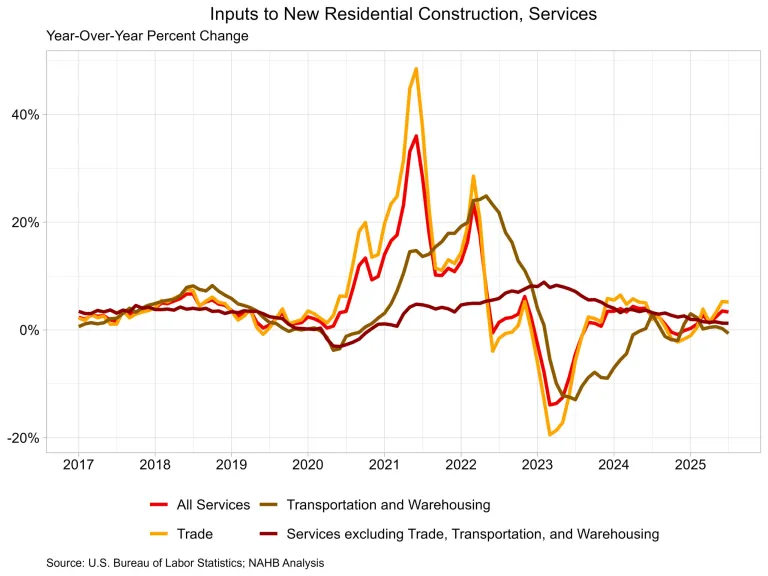
Input Services
In July, prices for residential building service inputs decreased by 0.2%. Year on year, service input prices have risen by 3.3%.
The price index for residential construction service inputs is divided into three components: trade services, transportation and warehousing services, and miscellaneous services.
Trade services account for over 60% of the total, followed by other services (about 29%) and transportation and warehousing services (approximately 11%).
The largest component, trade services, increased 5.2% over the previous year. The other services component increased by 1.2% over the previous year.
Finally, transportation and warehousing prices declined 0.6% from July of last year.
Inputs for New Construction Satellite Data
BLS just revealed fresh experimental data on inputs to new building in its PPI.
The data supplemented previous inputs to industry indices by combining import prices with domestically produced products and services.
With this extra data, consumers can track how industry input costs vary between domestically produced and imported items.
This data concentrates on new construction, however the whole dataset includes indexes for a variety of industries, which may be viewed on the BLS website.
Domestically produced goods and services have the greatest influence on new construction input prices, accounting for 90% of the industry index.
Imported items account for the remaining 10% of the index.
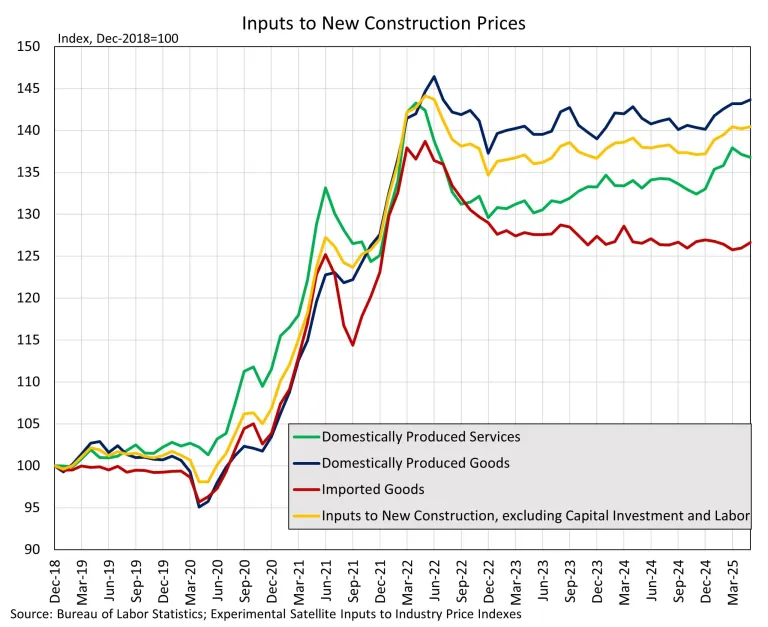
The most recent available statistics, for May 2025, revealed that locally produced commodities saw greater price growth than imported goods used in new construction.
The domestic products index increased 1.6% year on year, while import prices rose 0.1%.
In comparison, service prices have climbed 2.7% over the last year, outpacing goods prices.
All three indicators show that input prices remain higher than they were before the pandemic began.
[Read more about this topic on Eyeonhousing.org]