
In August, prices for residential building materials climbed for the fourth consecutive month, hitting their highest level since January 2023.
Domestic inputs products and services into residential building prices fell in August, while goods prices rose marginally.
Prices for new residential building inputs, excluding capital investment, labor, and imports, declined 0.1% in August, reflecting the 0.1% decrease in July.
These numbers are from the most recent Producer Price Index (PPI) report released by the United States Bureau of Labor Statistics.
The PPI measures the prices that domestic producers receive for their goods and services; in contrast, the Consumer Price Index examines what consumers pay for both domestic and imported items.
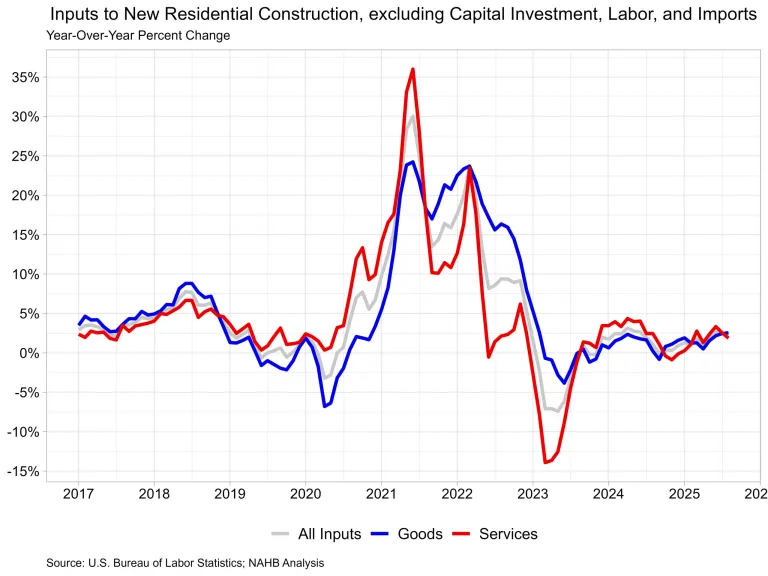
The inputs to the new home building price index increased by 2.3% from August of last year.
The index is divided into two components: products, which gained 2.6% during the year, and services, which rose 1.9%.
For reference, the total final demand index, which measures all products and services in the economy, rose 2.6% year on year, with final demand for goods rising 2.1% and final demand for services rising 2.9%.
Compared to July, the August findings show that services price growth decreased while goods price growth increased, according to producer pricing.
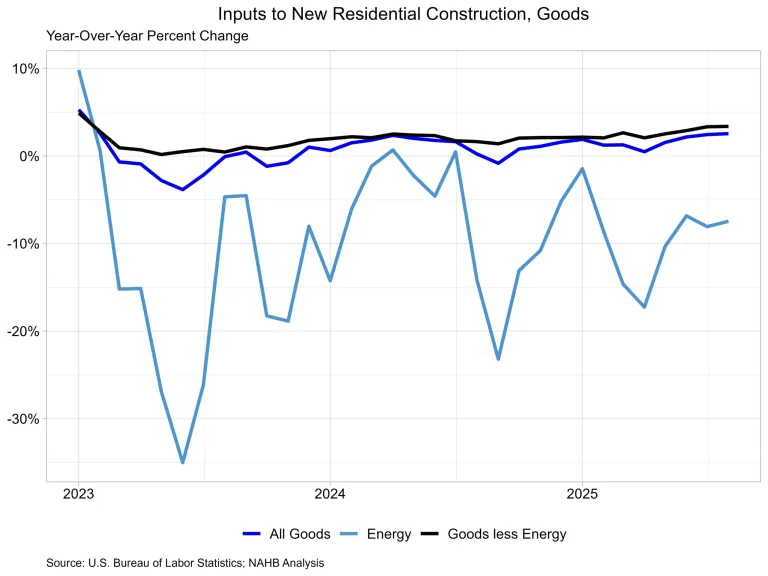
Input Goods
The goods component accounts for approximately 60% of the inputs to the residential building price index.
The monthly price of input commodities for new home building increased by 0.1% in August.
The input goods to the residential construction index are further divided into two components, one assessing energy inputs and the other measuring leftover products.
The latter of the two components essentially indicates building materials used in residential construction, which accounts for around 93% of the goods index.
Energy input prices declined 1.8% in August, and they were 7.5% lower than a year ago. Building materials prices rose 0.3% in August and 3.4% year on year.
This was the second month in a row that prices rose by more than three percent, following a 3.3% increase in July.
The August annual increase was the biggest since construction material prices increased 4.9% in January 2023.
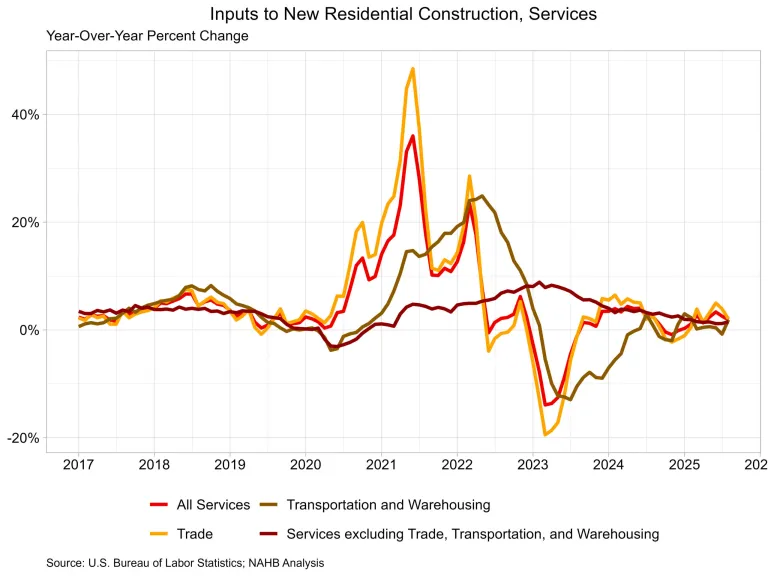
Input Services
In August, prices for residential building service inputs decreased by 0.5%. Year over year, service input prices are up 1.9%.
The price index for residential building service inputs is divided into three categories: trade services, transportation and warehousing services, and miscellaneous services.
Trade services account for over 60% of the total, followed by other services (roughly 29%) and transportation and warehousing services (around 11%).
The largest component, trade services, increased 2.0% over the previous year. The other services component increased by 1.5% during the year.
Finally, transportation and warehousing service prices grew 1.9% in August compared to the previous year.
Expanded Inputs to New Construction Data
New experimental data on inputs for new construction was just provided in the BLS’s PPI. The data supplemented current industry index inputs by include import prices as well as prices for domestically produced goods and services.
With this new information, consumers can monitor how industry input costs vary between domestically produced and imported items.
This data concentrates on new construction, however the whole dataset contains indices from a variety of industries, which may be viewed on the BLS website.
Domestically produced goods and services have the greatest influence on new construction input prices, accounting for 90% of the weight in the industry index.
Imported items comprise the remaining 10% of the index.
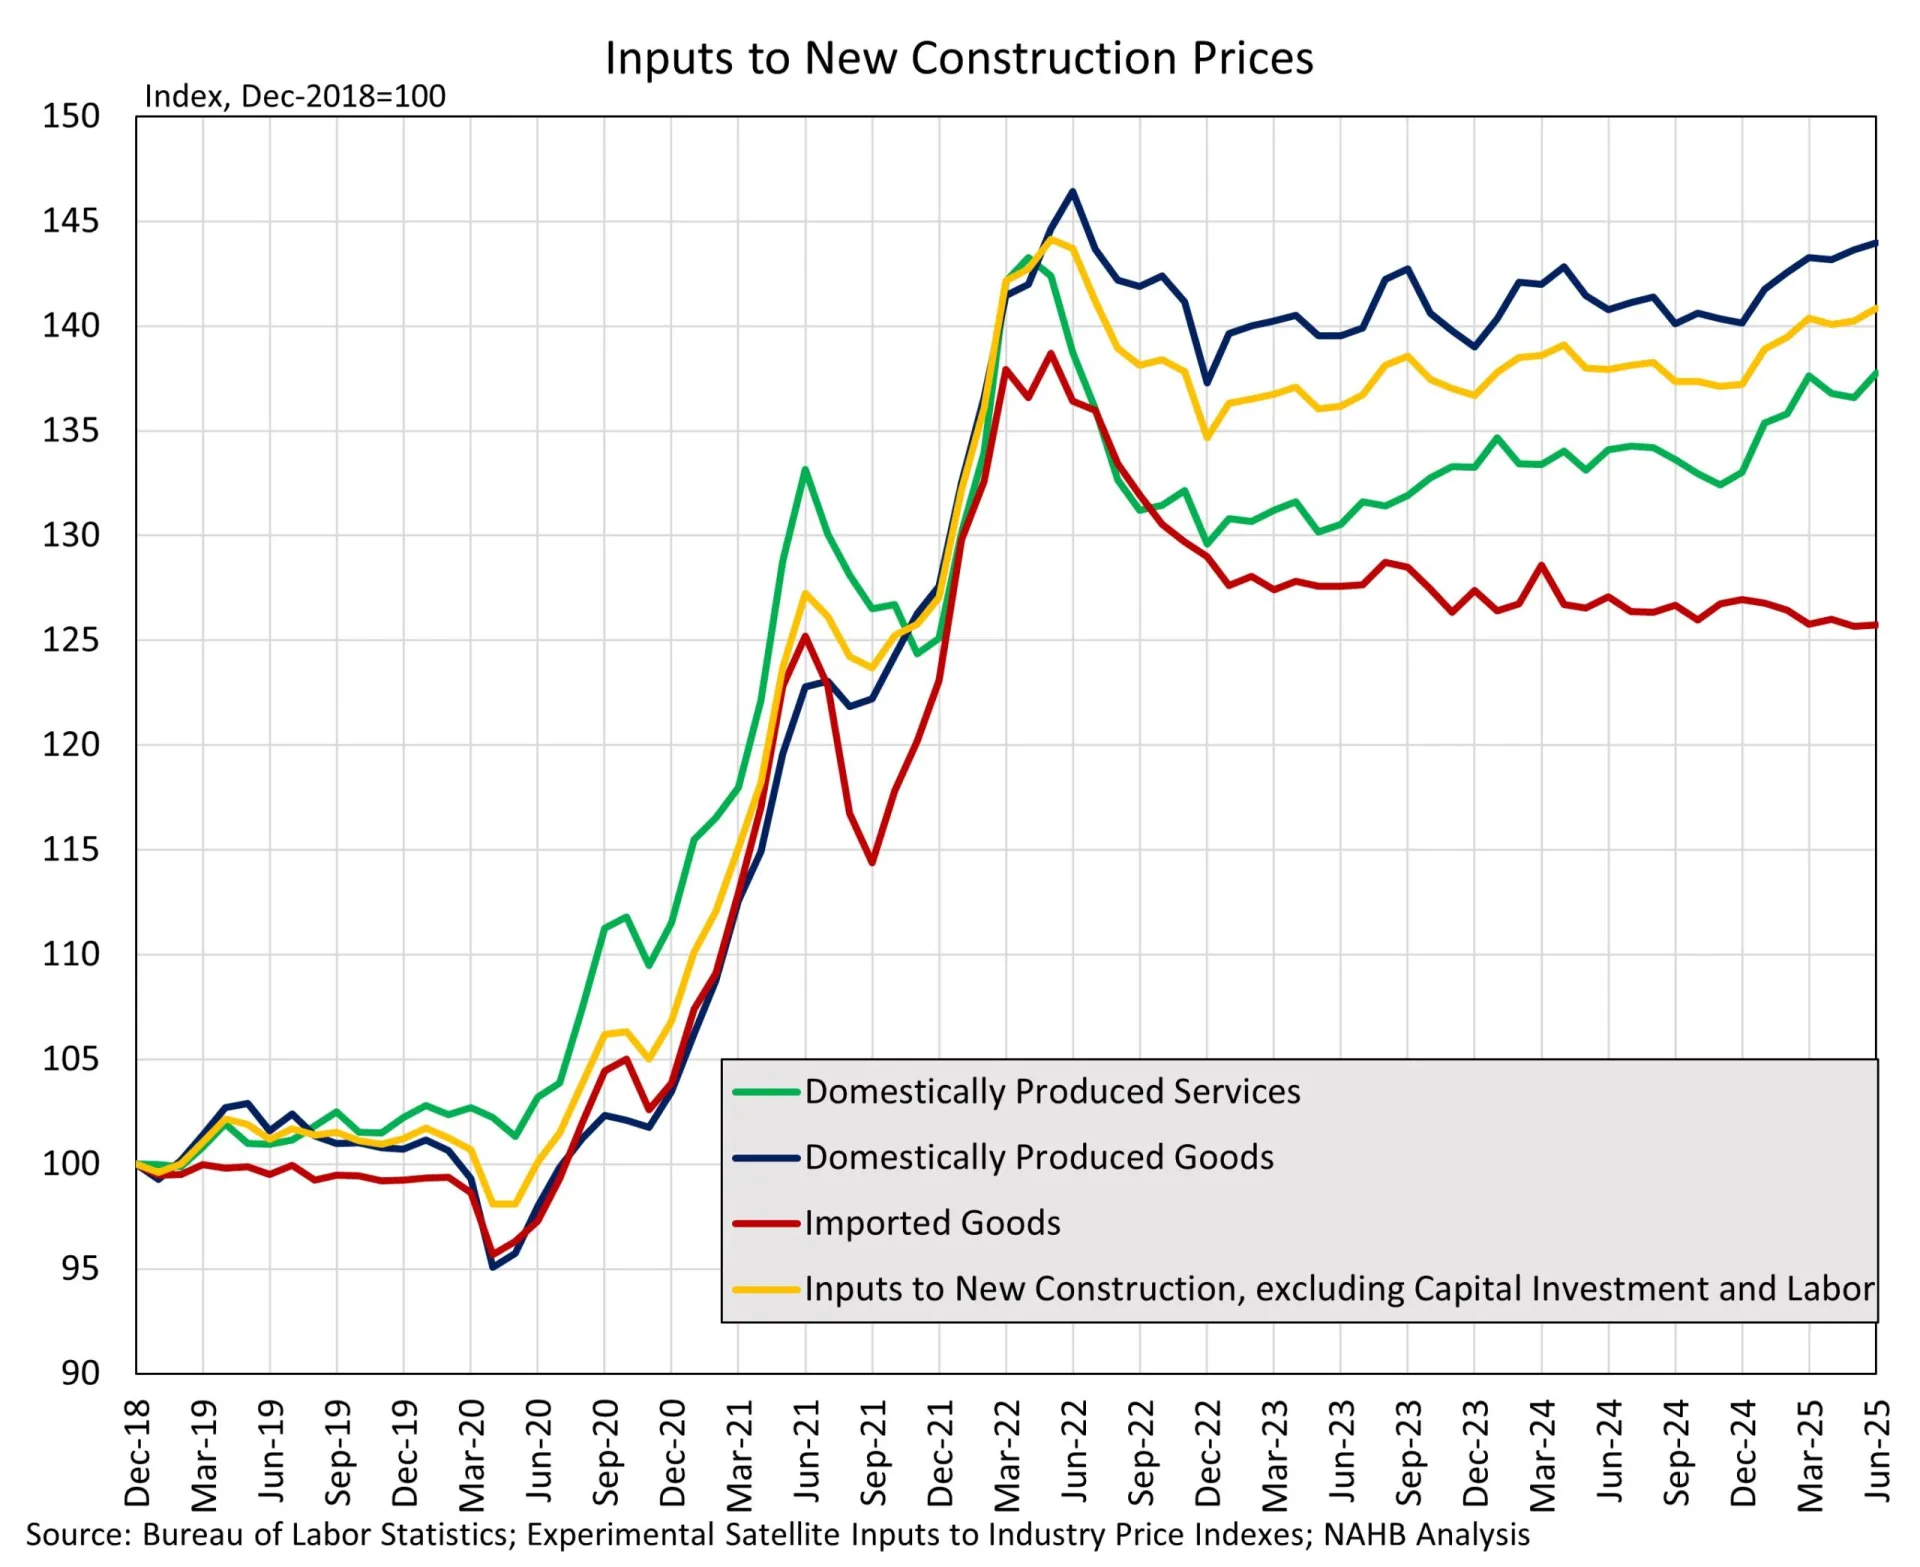
Domestically produced commodities continue to have quicker price rise than imported goods utilized in new construction, according to the most recent available statistics for June 2025.
The domestic goods index grew 2.3% year on year, while import prices declined 1.1% during the same time.
Service prices have climbed 3.0% year on year, outpacing good prices. The total index for inputs to new construction is up 2.1% year on year.
[Read more about this topic on Eyeonhousing.org]