
In 2024, the nation’s housing supply was further strained by the robust labor market growth, which meant that home building activity did not completely keep up with the demand generated by job growth.
The comparison of net new jobs with prior-year permitting activity is a useful tool for determining whether the pace of housing construction is in alignment with prospective household formation and broader economic growth.
The typical time required for permitted units to progress through the construction pipeline and reach the market is reflected in this analysis, which measures the net new jobs created in 2024 against the housing permits issued in 2023.
In 2024, the U.S. economy added approximately 1.8 million net new jobs in comparison to 2023, and the total number of housing permits issued in 2023 reached 1.51 million units. This information was obtained using this framework.
This yields an overall employment-to-permits ratio of 1.2, which suggests that the economy generated 1.2 new jobs for each housing unit authorized.
According to recent data, the historical average for a “balanced” ratio of jobs-to-permits has been between 1.25 and 1.5 jobs per housing permit.
Nevertheless, it is crucial to acknowledge that this ratio is significantly influenced by the affordability of the houses being constructed and the income levels of new employment in the respective sub-regions.
Consequently, this metric is most beneficial when applied to metropolitan areas (MSAs), particularly at the extremes of the distributions.
High ratios suggest that areas with a housing deficit are job-heavy, while lower ratios suggest that there are more housing units available than new jobs added.
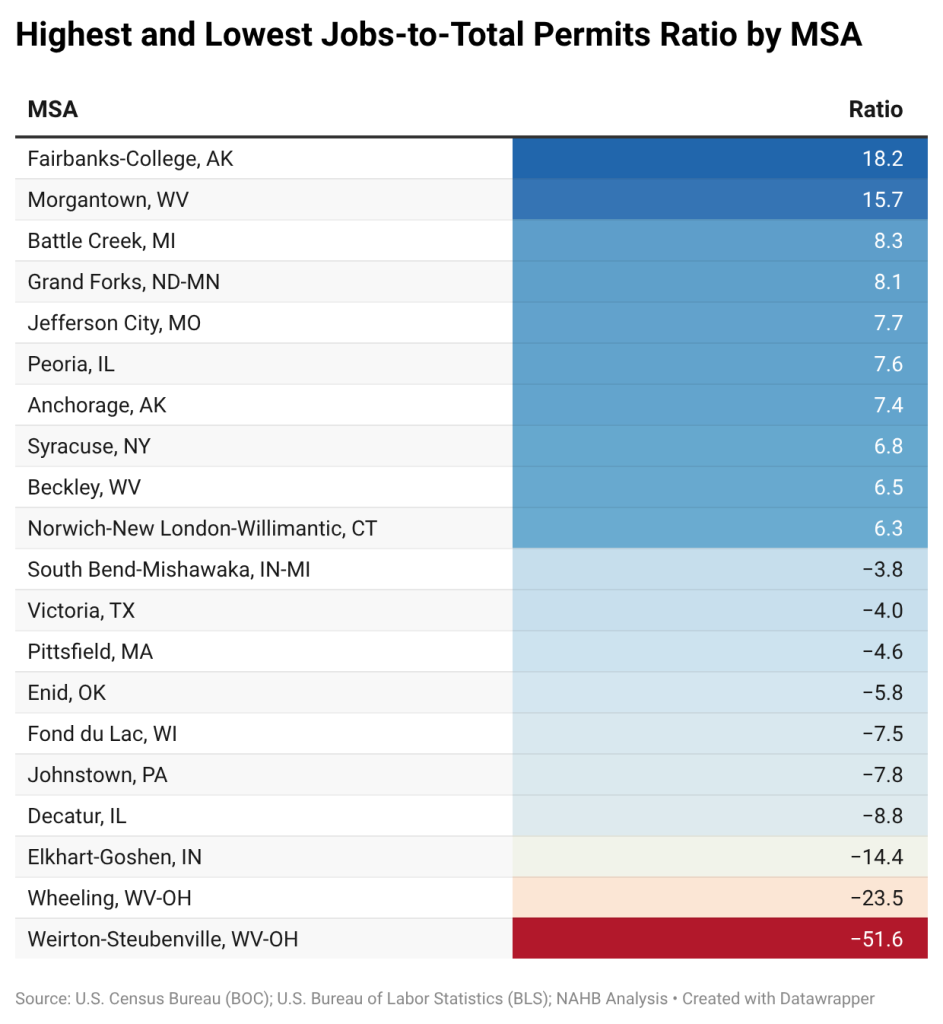
The chart below displays the ten metro areas with the highest jobs-to-total permits ratios, with Fairbanks, AK leading the pack with 18.2 new jobs per housing permit.
Morgantown, WV; Battle Creek, MI; Grand Forks, ND; and Jefferson City, MO are additional metropolitan areas with remarkably high ratios.
In the majority of instances, these elevated ratios are indicative of housing markets in which residential construction has not kept pace with employment growth.
Simultaneously, several of these metropolitan areas are relatively diminutive and issue a restricted number of permits.
Consequently, even minor job growth can result in disproportionately high ratios.
The structural impediments to housing production, such as smaller builder industries, higher development costs, labor shortages, limited infrastructure expansion, or restrictive land availability, may also be reflected in these elevated ratios.
In general, metro areas with low jobs-to-total permits ratios, such as Weirton, OH; Wheeling, OH; Elkhart, IN; Decatur; and Johnstown, PA, are indicative of markets where housing permitting activity has remained relatively stable despite feeble, stagnant, or declining employment growth.
Due to demographic challenges, slower population growth, or structural economic adjustments away from manufacturing, labor market expansion has been delayed in numerous older industrial or slower-growth regions.
In the event that job creation is restricted, even modest levels of residential permitting can result in comparatively low ratios.
In general, lower ratios indicate that the housing supply pressures are less acute; however, they may also indicate that the underlying economic and population growth is weaker and that the vacancy rates are higher.
Single-Family Homes Construction
A more comprehensive understanding of the owner-occupied housing market is achieved by concentrating on single-family permits.
The jobs-to-single-family permits ratio in 2023 was 1.84, indicating that nearly two new jobs were created for every single-family permit authorized, with 975,584 single-family permits issued.
This elevated ratio indicates that the owner-occupied housing market is still experiencing ongoing supply constraints.
New home production has been hindered by higher construction costs, elevated mortgage rates, labor shortages, and limited lot availability.
Subsequently, affordability conditions continue to deteriorate and home prices continue to increase.
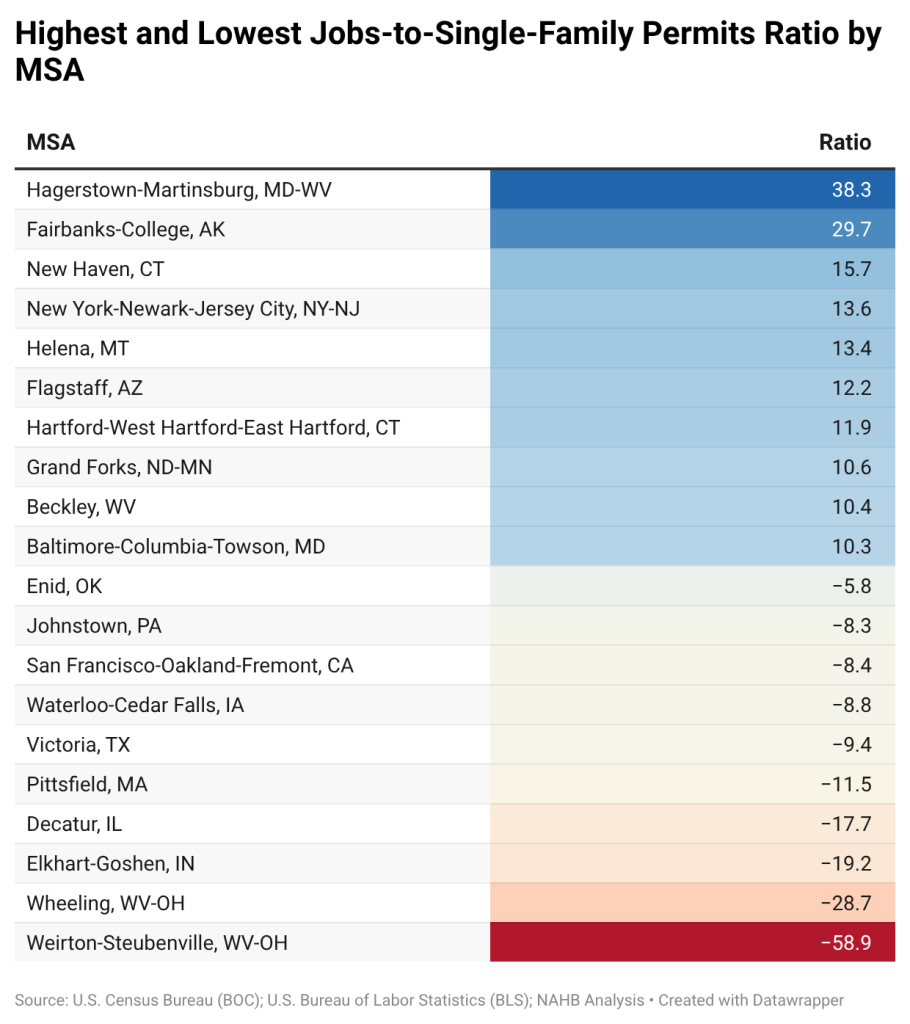
Metro areas with notably high jobs-to-single-family permits ratios, as illustrated below, underscore this imbalance.
Hagerstown–Martinsburg (38.3), the metro area with the highest ratio, witnessed a robust commuter demand that exceeded the local single-family construction pipeline.
Land-use constraints and elevated development costs are particularly severe in large Northeastern markets, including New York and New Haven.
In the interim, lesser markets such as Fairbanks and Helena frequently face infrastructure constraints, limited builder capacity, and elevated material or transportation costs.
In general, the elevated single-family ratios in these metros indicate that the owner-occupied housing market is tight, with new home construction continuing to languish behind employment-driven demand.
The trends observed in the total permits analysis are generally mirrored in the metro areas with low single-family jobs-to-permits ratios, such as Weirton, Wheeling, Elkhart, Decatur, and Pittsfield. In these areas, the pressure on local housing markets has been reduced by weaker employment growth and slower population increases.
In these metropolitan areas, single-family permitting activity has remained relatively stable or sufficient in comparison to modest labor market expansion, resulting in lower ratios than in faster-growing regions.
Numerous of these regions are distinguished by mature or slower-growing economies that are associated with legacy manufacturing or industrial sectors. In these regions, demographic growth has been restricted, and housing demand has remained relatively tepid.
In general, the low ratios indicate that the supply pressures on owner-occupied housing are less severe in these metros.
However, they also indicate that the economic momentum and household formation patterns are weaker in comparison to those of higher-growth markets.
Construction of multifamily residences
The transition to multifamily permits provides us with a signal regarding the rental market’s response to labor market expansion.
The jobs-to-multifamily permits ratio in 2023 was 2.61, indicating that approximately 2.6 new jobs were generated for each multifamily unit approved, based on the 689,504 multifamily permits (units) that were issued.
Multifamily construction has been notably instrumental in the expansion of new supply in large, high-demand metropolitan areas, despite the fact that this ratio is higher than the single-family measure.
The jobs-to-permits ratios depicted in the illustration below are derived from permits issued within the top 100 metropolitan statistical areas of the United States for the local-area multifamily component of this analysis.
Multifamily development is highly concentrated in large urban markets, and this restricted geographic focus is employed to prevent dilution by smaller metros with limited or infrequent multifamily construction.
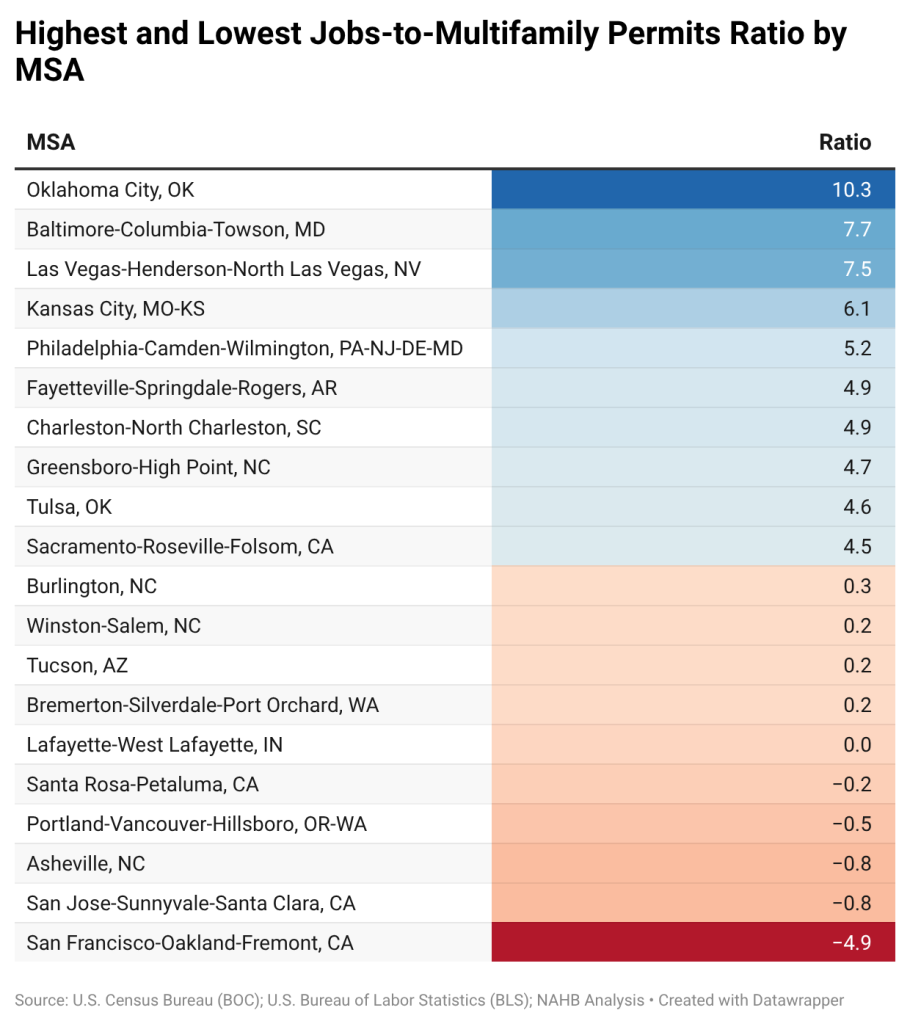
In general, metro areas with high multifamily jobs-to-permits ratios, such as Oklahoma City, Baltimore, Las Vegas, Kansas City, and Philadelphia, indicate markets where employment growth has significantly outpaced multifamily permitting activity.
This suggests that rental market conditions are tighter and that the apartment supply pipelines are relatively constrained.
In these regions, elevated ratios may indicate a greater need for additional multifamily supply to accommodate ongoing economic and demographic growth, lower vacancy rates, and increasing pressure on rental affordability.
The metro areas that exhibit low or negative multifamily ratios, such as San Francisco, San Jose, Asheville, Portland, and Santa Rosa, are generally indicative of markets where multifamily permitting activity has exceeded job growth or where employment conditions have deteriorated in comparison to previous construction cycles.
Earlier rounds of multifamily development, remote work shifts, and weaker in-migration, in conjunction with slower tech-driven job growth, have resulted in supply running ahead of demand in several high-cost coastal metros, particularly in the Bay Area and Portland.
These imbalances in the rental markets can be exacerbated by seasonal employment in lesser or tourism-oriented markets, such as Asheville and Santa Rosa–Petaluma.
Collectively, these results underscore the persistent obstacle of reconciling housing production with labor market expansion.
Although the national jobs-to-permits ratio has converged with historical norms, substantial disparities persist in metropolitan areas, particularly in markets where robust employment growth continues to surpass new housing construction.
In addition, the findings underscore significant distinctions between owner-occupied and rental housing markets.
Single-family construction is confronted with more persistent supply constraints, whereas multifamily development has assisted in accommodating a portion of the increasing demand in numerous large metropolitan areas.
In order to resolve the nation’s housing deficit, it will be imperative to maintain an ongoing increase in housing production.
The disparity between housing supply and demand has begun to narrow as a result of recent increases in multifamily completions and permitting activity.
Nevertheless, this result will be contingent upon the persistence of a consistent tempo of new construction, the enhancement of housing affordability, and the surmounting of persistent obstacles associated with financing costs, labor availability, land development, and regulatory barriers.
[Read more about this topic on Eyeonhousing.org]