
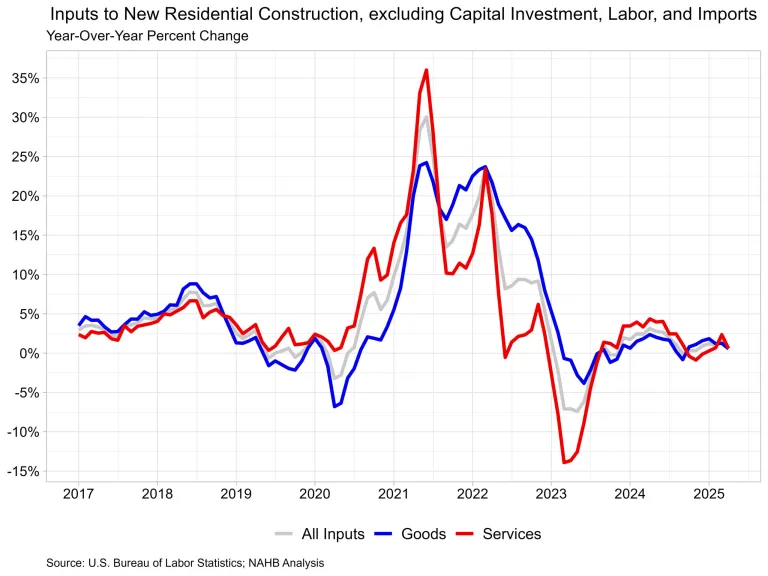
In April, prices for inputs to new residential construction—excluding capital investment, labor, and imports—fell 0.4% after rising (revised) 0.8% in March.
These numbers are from the most recent Producer Price Index (PPI) report issued by the United States Bureau of Labor Statistics.
The PPI monitors the prices received by domestic producers for their goods and services, as opposed to the Consumer Price Index, which measures what consumers spend for both domestic and imported goods.
Inputs to the New Residential Construction Price Index increased 0.6% from April of last year. The index is divided into two components: goods and services.
The goods component increased by 0.6% over the year. For comparison, the overall final demand index, which measures all products and services in the economy, climbed 2.4% over the year, with final demand for commodities rising 0.5% and final demand for services rising 3.3%.
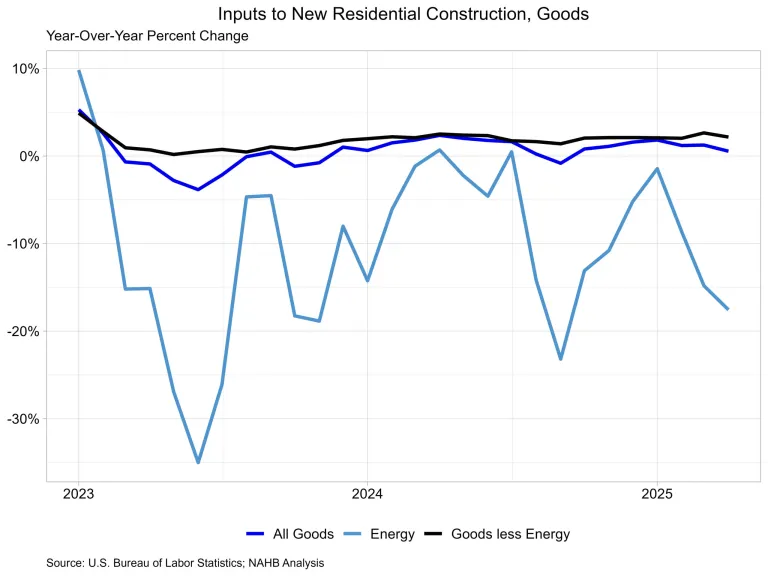
Input Prices for Goods
The goods component accounts for roughly 60% of the total residential building inputs price index.
In April, the price of input commodities for new residential building fell by 0.2%.
The input goods to residential building index can be further divided into two components, one assessing energy inputs and the other measuring items that do not require energy input.
The latter of these two components essentially indicates building materials utilized in residential construction, which account for around 93% of the goods index.
Energy input prices rose 0.1% between March and April, but remained 17.6% lower than a year ago.
Building material prices fell 0.3% between March and April, but increased 2.2% over the previous year.
Energy expenses have continued to reduce year over year, with this being the ninth consecutive month of lower input energy costs.
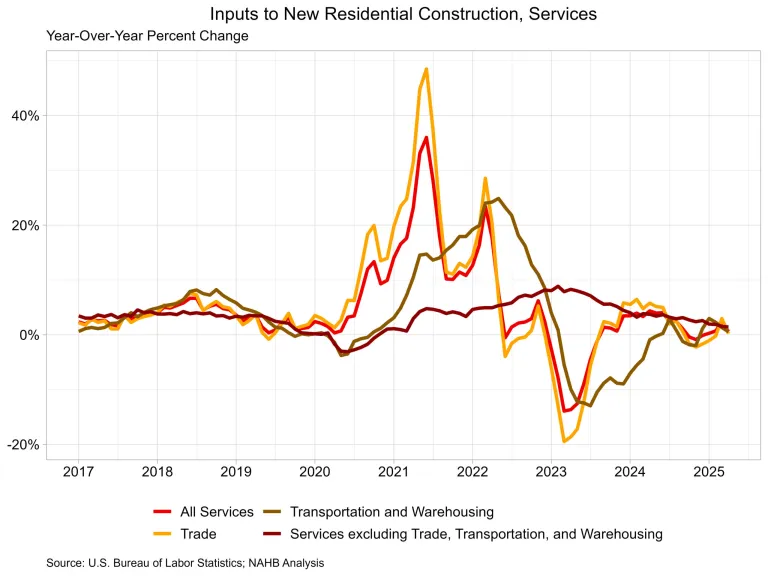
Input Service Prices
In April, prices for residential construction service inputs fell 0.6%, marking the first monthly fall in five months. Prices for service inputs have risen by 0.6% year on year.
The price index for residential building service inputs is divided into three categories: trade services, transportation and warehousing services, and miscellaneous services.
Trade services account for over 60% of the total, followed by other services (roughly 29%) and transportation and warehousing services (around 11%).
Trade services, the largest component, rose 0.2% over the previous year. The other services component increased by 1.4% during the year.
Finally, transportation and warehousing service prices increased by 0.6% compared to April of previous year.
[Read more about this topic on Eyeonhousing.org]