
In May, prices for new residential building inputs—excluding capital investment, labor, and imports—rose 0.2%, following a (revised) 0.2% fall in April.
These numbers are from the most recent Producer Price Index (PPI) report released by the United States Bureau of Labor Statistics.
The PPI measures the prices that domestic producers receive for their goods and services; in contrast, the Consumer Price Index examines what consumers pay for both domestic and imported items.
The inputs to the New Residential Construction Price Index increased by 1.9% from May of last year.
The index is divided into two components: products increased 1.6% during the year, while services increased 2.3%. For comparison, the overall final demand index, which measures all products and services in the economy, rose 2.6% over the year, with final demand for goods rising 1.3% and final demand for services rising 3.2%.
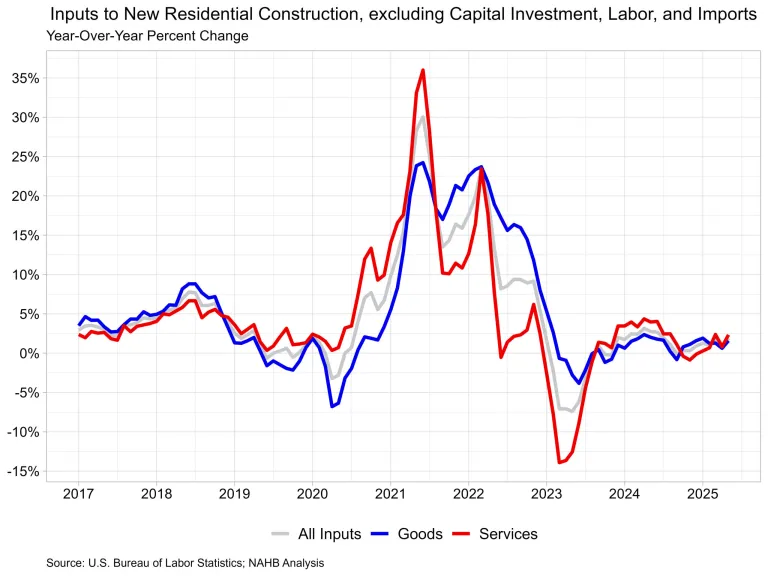
Input goods
The goods component represents approximately 60% of the total residential building inputs price index.
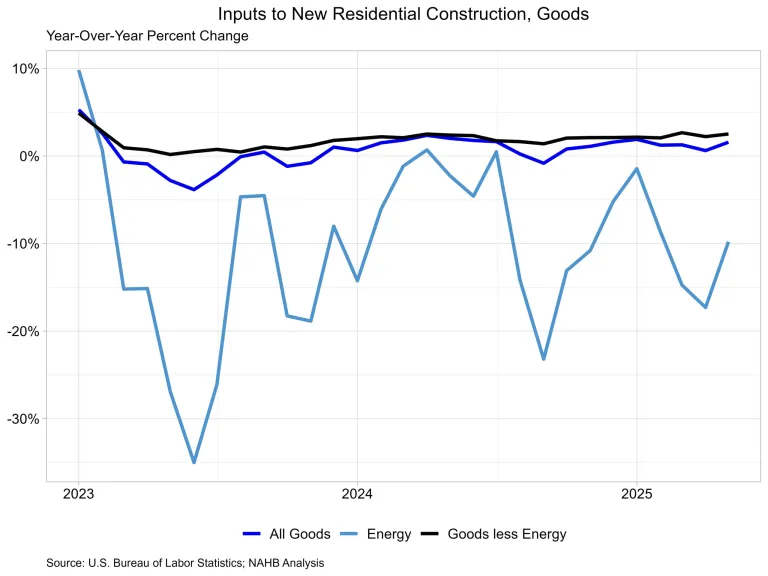
The price of input commodities for new home building increased 0.1% in May.
The input goods to the residential construction index are further divided into two components, one assessing energy inputs and the other measuring leftover products.
The latter of the two components essentially indicates building materials used in residential construction, which accounts for around 93% of the goods index.
Energy input prices rose 0.8% between April and May, but they were 9.8% lower than a year earlier.
Building material prices increased by 0.1% between April and May, and by 2.5% over the previous year.
The commodity with the biggest monthly growth in May among building material inputs was parts for construction machines and equipment, which grew 6.8% after gaining 8.4% the previous month.
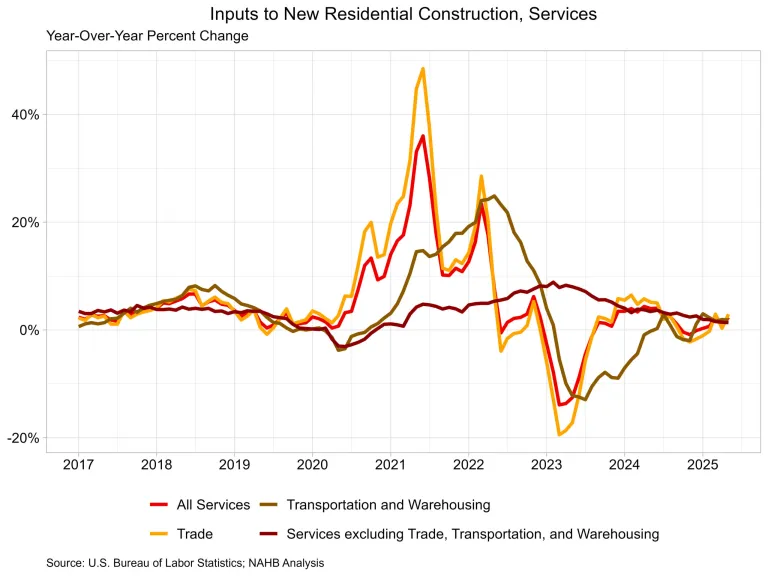
Input Services
In May, prices for service inputs to residential building rose by 0.3%. Year on year, service input prices have risen by 2.3%.
The price index for residential construction service inputs is divided into three components: trade services, transportation and warehousing services, and miscellaneous services.
Trade services account for over 60% of the total, followed by other services (about 29%) and transportation and warehousing services (approximately 11%).
The largest component, trade services, increased 2.9% over the previous year. The other services component increased by 1.4% over the previous year.
Finally, transportation and warehousing service prices increased 1.8% in May compared to the previous year.
Inputs for New Construction Satellite Data
BLS just revealed fresh experimental data on inputs to new building in its PPI.
The data supplemented previous inputs to industry indices by combining import prices with domestically produced products and services.
With this extra data, consumers can track how industry input costs vary between domestically produced and imported items.
This data concentrates on new buildings, but the full dataset, which contains indices from a variety of businesses, may be found here.
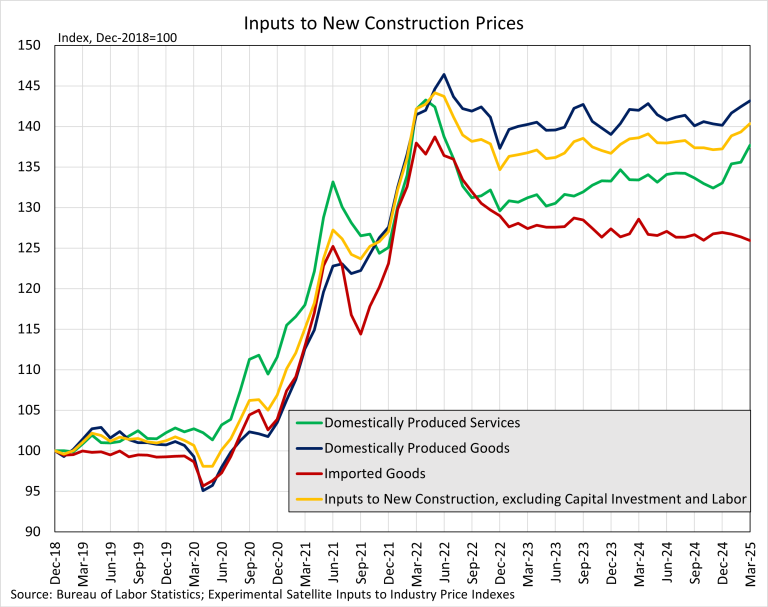
Domestically produced goods and services have the greatest impact on new construction input prices, accounting for 90% of the industry index’s weight.
Imported items account for the remaining 10% of the index. The most recent available statistics, for March 2025, revealed that domestically manufactured items had undergone greater price growth than imported goods used in new construction.
The domestic products index rose 0.8% year on year, while imported input prices declined 2.1%. Over the last year, services prices have risen more than good inputs for new construction, with domestic services prices increasing by 2.2%.
All three indicators show that input prices remain higher than they were before the pandemic began.
[Read more about this topic at Eyeonhousing.org]