
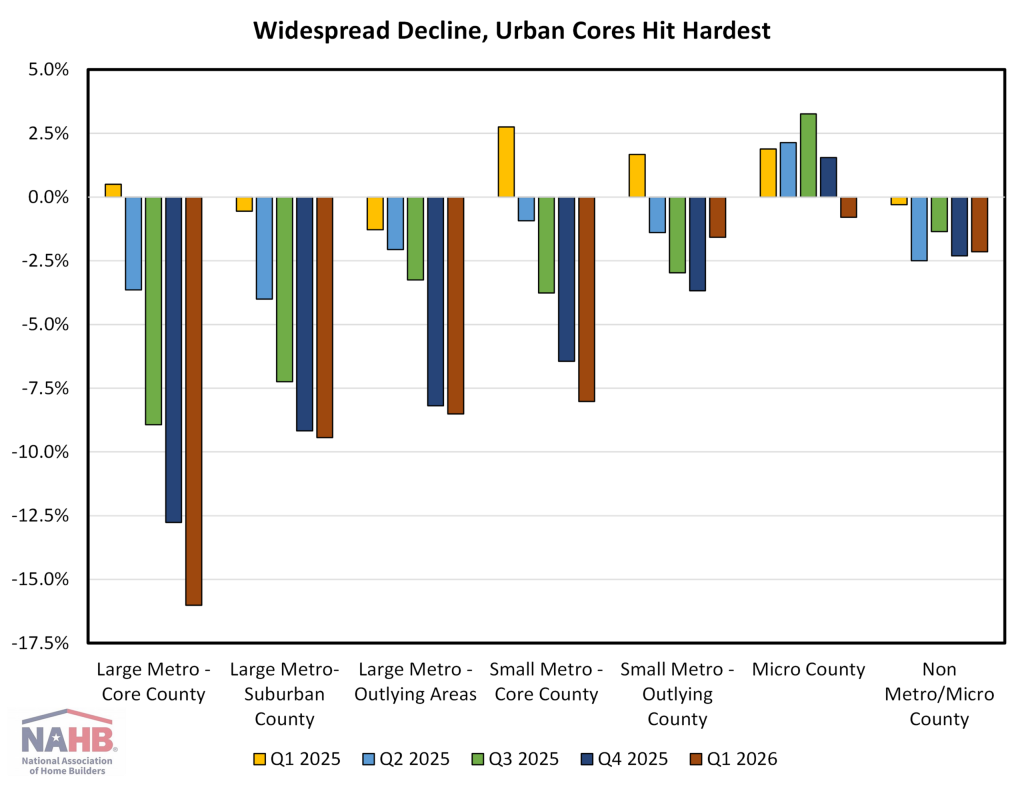
The latest Home Building Geography Index (HBGI) indicates that single-family construction decreased in all geographies during the first quarter of 2026.
This decline was attributed to the slowdown in home building activities at the beginning of the year, which was exacerbated by elevated interest rates, rising material costs, and labor shortages.
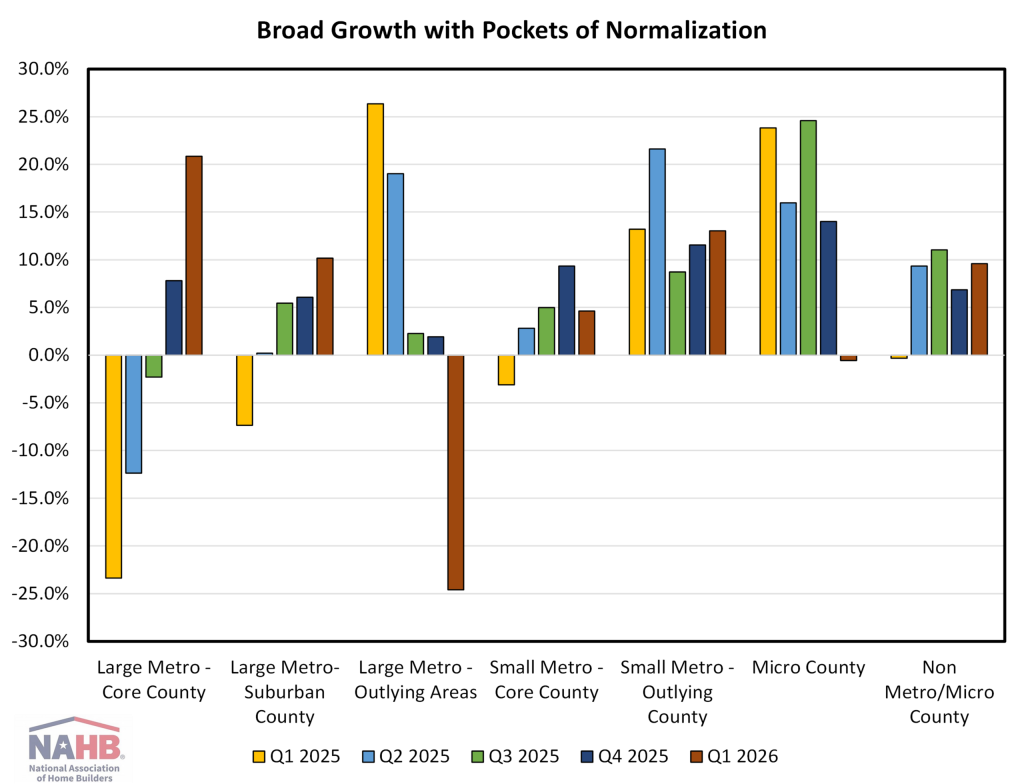
Meanwhile, multifamily construction maintained a high level of resilience, exhibiting growth in the majority of markets.
Single- Family
Large metro core counties experienced the most significant decline in single-family activity, with a 16.0% year-over-year decline on a four-quarter moving average (4QMA) basis.
This represents a 3.2 percentage point decline from the previous quarter.
To put it more broadly, single-family construction in non-rural areas, which are counties within a metro area, experienced a 9.2% decline.
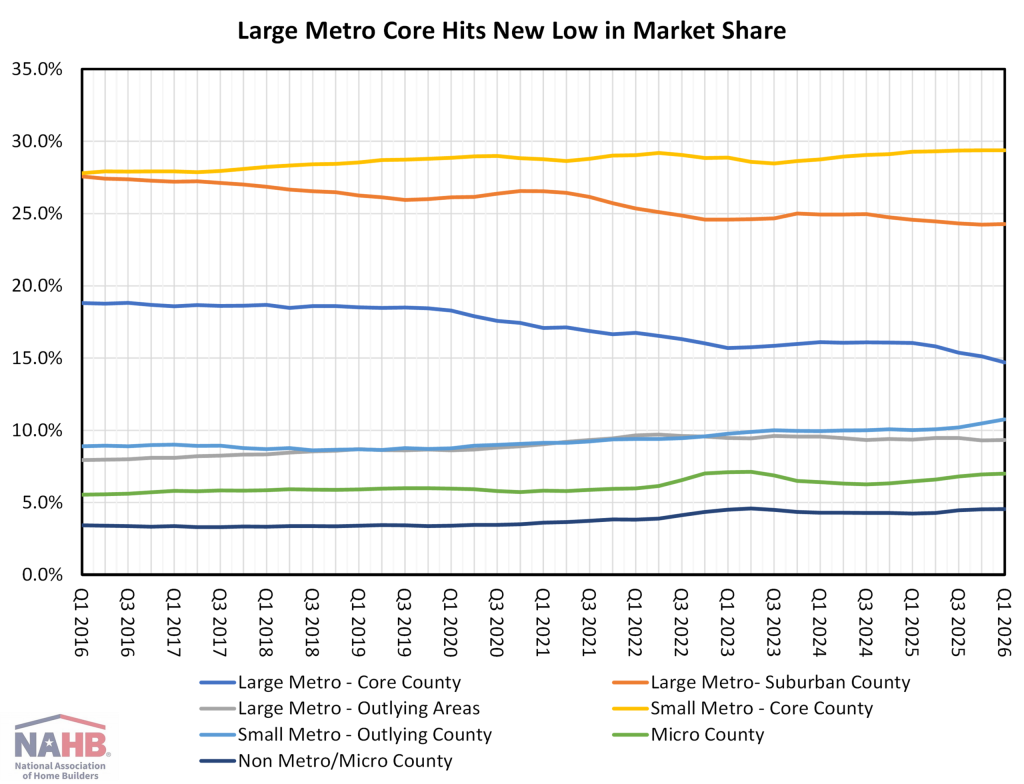
A longer-term structural transition away from dense population centers is contributing to these declines. The velocity of decrease in single-family market share in large metro core counties has increased after the pandemic, with an average of 0.1 percentage points lost each quarter over the past decade.
The percentage of single-family permits issued by large metro cores in Q1 2026 was 14.7%, a decrease of 1.3 percentage points from the previous year and 4.1 percentage points below their proportion in Q1 2016.
In a similar vein, the market share of large metro suburban counties has decreased by 3.3 percentage points over the past decade.
Outlying and lesser markets have reaped the benefits.
The most significant increase was observed in outlying counties in minor metros, which gained nearly two percentage points in comparison to a decade ago and 0.7 percentage points in relation to Q1 2025, resulting in a 10.8% market share.
Multifamily
In Q1 2026, multifamily construction provided a distinct narrative, expanding across the majority of regions.
Leading the way were large metro core counties, which experienced a 20.8% growth rate (4QMA) and continued to accelerate after returning to positive territory in the previous quarter.
Constructing in non-rural counties experienced an overall increase of 10.5%.
The largest metro outlying counties experienced a 24.6% decline, while micro counties experienced a 0.6% decline.
These markets exhibited negative growth. Both had demonstrated consistent development in 2025 and seem to be settling into a norm.
Multifamily growth in rural counties experienced a significant decline, with a drop from 11.4% in the previous quarter to a mere 1.8% generally.
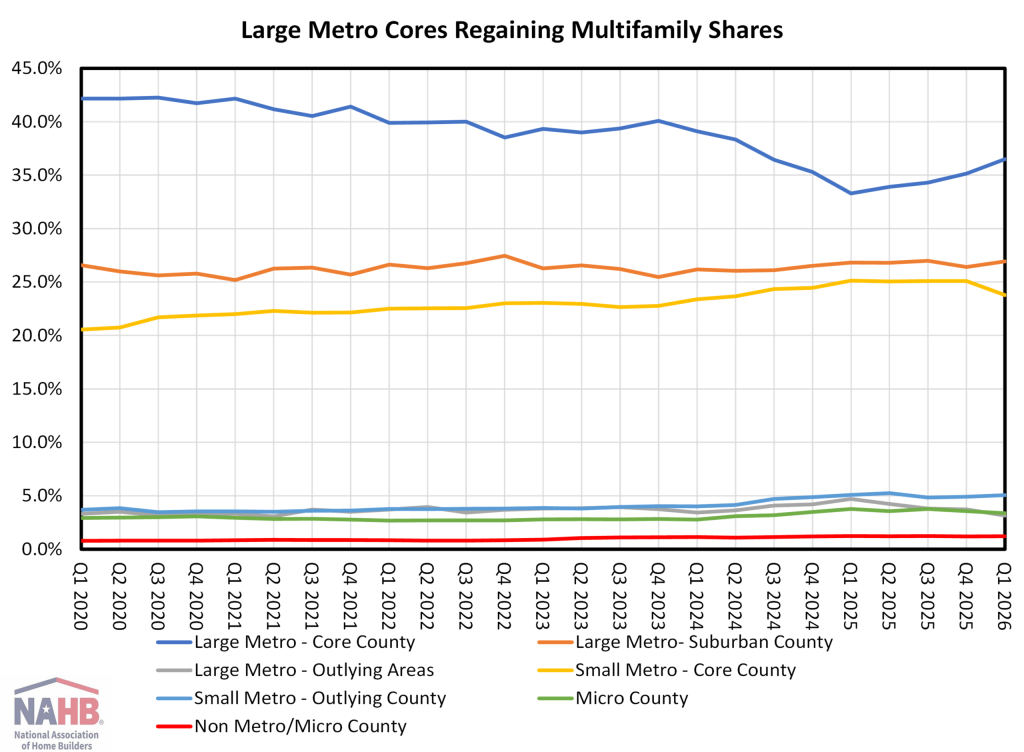
The largest multifamily share increase in the market was in the large metro core, which increased by 3.2 percentage points to 36.5%.
The steepest decline was observed in large metro outlying counties, which experienced a 1.6 percentage point decrease over the course of the year, resulting in a 3.1% decrease.
The multifamily market share has migrated gradually but steadily from major metro core counties to smaller metro core counties over the past decade, with the former losing 8.6 percentage points and the latter gaining 5.1 percentage points.
This migration has occurred over a longer horizon. On the contrary, the demand for rental housing has remained robust, and major metro core counties have gradually regained market share since last year.
For the first quarter of 2026, the HBGI data and an interactive HBGI map are available at nahb.org/hbgi.
[Read more about this topic on Eyeonhousing.org]